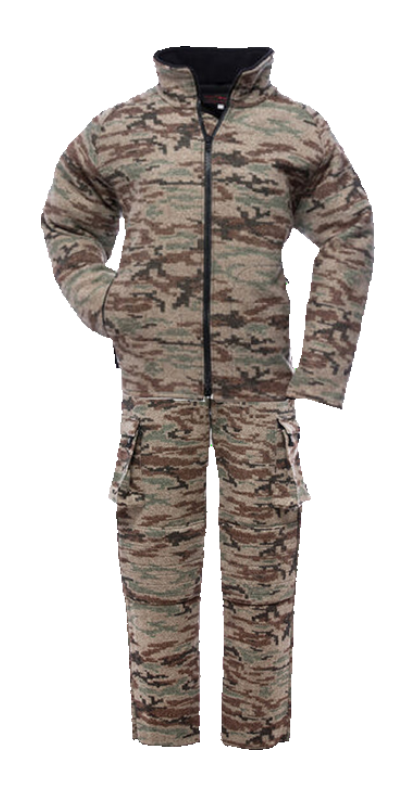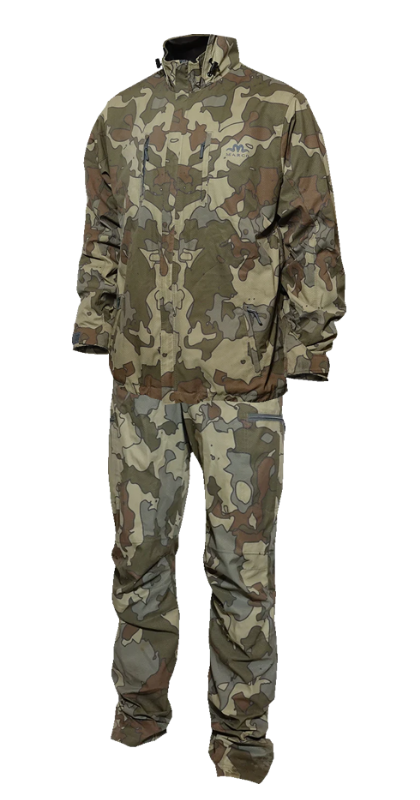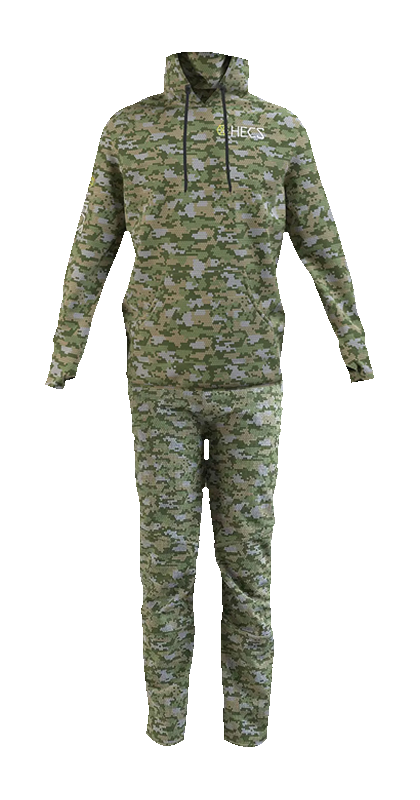
CamoMatrix Pattern DNA
HECS Hunting
Anywhere
This pattern stands out most for middle-range overall brightness, very low tonal separation; softer, weaker edge structure; and smooth, evenly distributed texture.
The dominant detected color families are Olive / Tan. Its average color saturation is typical compared with the 247-pattern reference set.
What you may notice:
The amount of visible color intensity is fairly typical of the reference set.
17.7% of the sampled pattern falls in the governed dark tonal range. Its tonal groups are less distinctly separated than in most reference patterns.
What you may notice:
The pattern does not sit near either brightness extreme of the reference set.
Edge density is typical, average detected edge strength is very low, and the share of qualifying edges classified as hard is very low relative to the reference set.
What you may notice:
Detected boundaries tend to transition more gently than in many reference patterns.
Fine texture density is typical, roughness is low, and texture uniformity is very high compared with the reference set.
What you may notice:
Texture activity is distributed more consistently across the pattern.
Effective retained-region fragmentation is very low, while average retained-region elongation is very low relative to the reference set.
What you may notice:
The visible structure is concentrated into fewer effective regions than in many reference patterns.
The analyzer classifies dominant scale as balanced. Fine-scale energy is high, mid-scale energy is typical, and large-scale energy is typical relative to the reference set.
What you may notice:
No single scale band dominates strongly enough to define the pattern by itself.
Spatial information balance is typical, while left-right, top-bottom, and rotational asymmetry are typical, typical, and typical relative to the reference set.
What you may notice:
The spread of visual activity is broadly typical of the reference set.
This pattern appears best aligned with middle-brightness overall backgrounds. Its detected color families align with backgrounds containing tan dry grass, vegetation, bark, or exposed earth and subdued olive vegetation. Its lower tonal separation should fit flatter, more blended backgrounds. Its balanced scale favors backgrounds containing a mixture of visual detail sizes. Its smoother, more uniform texture aligns with backgrounds whose surface detail remains relatively consistent.
Its measured characteristics may make it less naturally matched to strongly broken or high-contrast backgrounds.
Detected boundaries tend to transition more softly.
How to read this:
These observations are derived from Pattern DNA measurements and comparisons with the frozen 247-pattern reference collection. They describe the kinds of visual backgrounds the pattern most closely aligns with; they are not a claim of field-tested performance in a specific location.
These are the closest measured matches based on Pattern DNA color, tone, texture, shape, scale and layout.
See other camouflage patterns that share measured visual characteristics with this pattern.