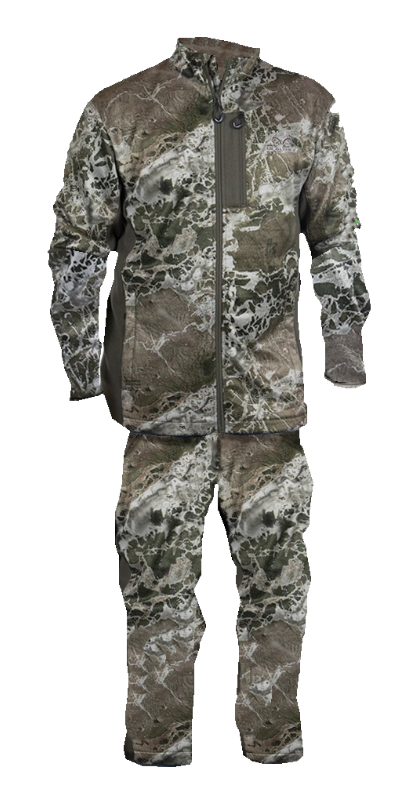
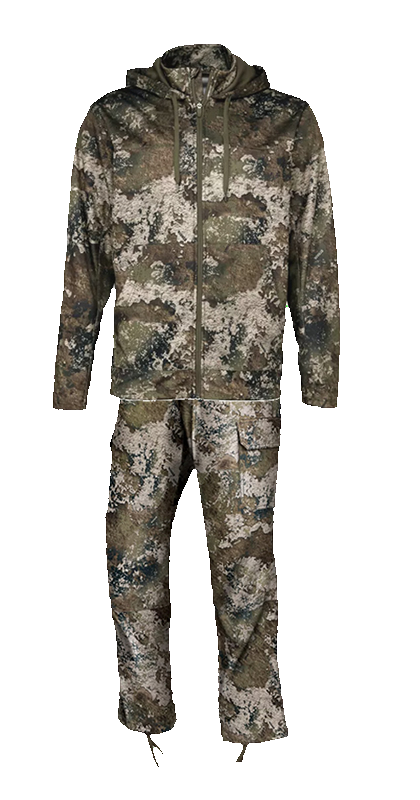
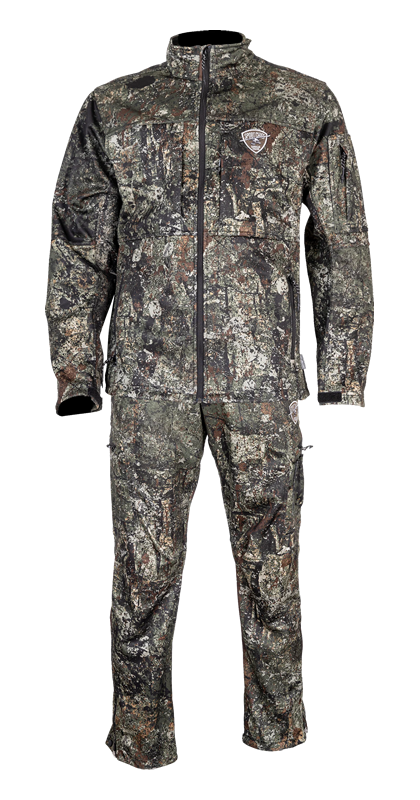
Sportschief The Ripper camouflage pattern
CamoMatrix Pattern DNA

Sportschief

The Ripper
This pattern stands out most for gray, very low saturation; even overall spread, with stronger directional imbalance; and middle-range overall brightness, typical tonal separation.

What Stands Out

Standout #1

Color Character

Gray, very low saturation
Very low saturation compared with the reference patterns.
Standout #2

Spatial Distribution

Even overall spread, with stronger directional imbalance
Very high information balance and low left right compared with the reference patterns.
Standout #3

Light & Dark Structure

Middle-range overall brightness, typical tonal separation
High tonal range compared with the reference patterns.

The Pattern at a Glance

Palette
Primary: gray
Secondary: —
Warm 98.3%
Cool 1.7%
Neutral 66.2%
Light & Dark
Dark 32%
Mid 61.6%
Light 6.4%
Dark, mid-tone and light areas measured across the analyzed pattern sample.
Pattern Scale
Fine 42.6%
Mid 27.7%
Large 29.7%
Dominant scale: micro

Pattern DNA

Color Character

Gray, very low saturation

The dominant detected color families are Gray. Its average color saturation is very low compared with the 247-pattern reference set.

What you may notice:
The pattern tends to read as muted or low-color rather than strongly colorful.

Light & Dark Structure

Middle-range overall brightness, typical tonal separation

32% of the sampled pattern falls in the governed dark tonal range. Its tonal-group separation is within the broad middle of the reference set.

What you may notice:
The pattern does not sit near either brightness extreme of the reference set.

Edge Character

Mixed edge structure

Edge density is high, average detected edge strength is typical, and the share of qualifying edges classified as hard is typical relative to the reference set.

What you may notice:
Boundary strength is broadly typical of the reference set.

Texture Character

Typical texture character

Fine texture density is high, roughness is typical, and texture uniformity is typical compared with the reference set.

What you may notice:
Texture variation across the pattern is broadly typical of the reference set.

Shape Character

Typical overall shape structure

Effective retained-region fragmentation is typical, while average retained-region elongation is typical relative to the reference set.

What you may notice:
The effective division of visible regions is broadly typical.

Pattern Scale

Fine-scale dominant

The analyzer classifies dominant scale as micro. Fine-scale energy is high, mid-scale energy is low, and large-scale energy is typical relative to the reference set.

What you may notice:
Small-scale visual structure makes the strongest contribution to the pattern.

Spatial Distribution

Even overall spread, with stronger directional imbalance

Spatial information balance is very high, while left-right, top-bottom, and rotational asymmetry are low, high, and high relative to the reference set.

What you may notice:
Visual activity is spread relatively evenly overall, but its arrangement is less symmetrical across one or more directions.
Where This Pattern Fits

Where It Fits

This pattern appears best aligned with middle-brightness overall backgrounds. Its detected color families align with backgrounds containing gray rock, bark, dead wood, or neutral material. Its fine-scale structure favors backgrounds containing substantial small, repeated visual detail. Its fine texture aligns with backgrounds containing substantial small surface detail.

Where It May Struggle

Its measured characteristics may make it less naturally matched to very broad or visually simple backgrounds.

Breakup Character

The pattern contains a relatively dense network of detected edges. Visual activity is distributed fairly evenly across the pattern.

How to read this:
These observations are derived from Pattern DNA measurements and comparisons with the frozen 247-pattern reference collection. They describe the kinds of visual backgrounds the pattern most closely aligns with; they are not a claim of field-tested performance in a specific location.

Most Similar Patterns

These are the closest measured matches based on Pattern DNA color, tone, texture, shape, scale and layout.

Explore Similar Pattern Traits

See other camouflage patterns that share measured visual characteristics with this pattern.